We use cookies to provide you with a better experience. By continuing to browse the site you are agreeing to our use of cookies in accordance with our Cookie Policy.

logo
  • Engineers & Specifiers
  • Contractors & Installers
  • Wholesalers & Distributors
  • Sign In
  • Create Account
  • Sign Out
  • My Account
Free Subscription
  • Sign In
  • Create Account
  • Sign Out
  • My Account
  • PRODUCTS
    • Bath & Kitchen
    • Fire Protection
    • HVAC
    • Hydronics/Radiant
    • Plumbing
    • PVF
    • Tools
  • PROJECTS
    • Commercial
    • Green Building
    • MRO/Retrofit
    • Remodeling
    • Residential
  • HOW TO
    • Design
    • Fire Protection
    • Legal Matters
    • Management
  • BUSINESS
    • Buying Groups
    • Technology
    • Associations
  • CODES & STANDARDS
    • ANSI
    • ASHRAE
    • ASSE
    • Regulations
    • Green Building
    • IAPMO
    • ICC
    • NFPA
  • RESOURCES
    • Media Kit
    • Advertise
    • Contact Us
    • Classifieds
    • Digital Editions
    • Behind the Wall
    • Webinars
    • AHR Live 2023
  • PODCASTS
  • DIGITAL EDITIONS
Home » Grumman/Butkus Associates 2016 survey examines hospitals’ energy efficiency

Grumman/Butkus Associates 2016 survey examines hospitals’ energy efficiency

February 27, 2017
No Comments
Hospitals' energy costs per square foot (red boxes) have fluctuated since 1999. Energy use intensity (Btu/sf/year) and energy costs (ft2/year) fell slightly in 2015. Chart (c)2016 Grumman/Butkus Associates.

Grumman/Butkus Associates, a firm of energy efficiency consultants and sustainable design engineers, released the results of its 2016 Hospital Energy and Water Benchmarking Survey, focusing on healthcare facilities’ resource usage trends and costs for calendar year 2015.

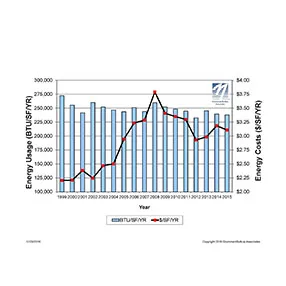
Since G/BA initiated the survey more than 20 years ago, hospitals’ overall fossil fuel use has trended downward, but electricity use isn’t declining as much. The average combined Btu/ft2 (electricity plus gas/steam) for participating facilities was 237,998 in CY2015, slightly down from 239,591 in CY2014.

Square-foot prices for gas/steam were down year-to-year ($0.82 in 2015, compared with $1.02 in 2014), but square-foot prices for electricity rose ($2.28 in 2015, vs. $2.16 in 2014.) The overall result is that hospitals’ total ft2 costs for energy (gas/steam plus electric) declined: $3.11 for 2015, compared with $3.18 for 2014.

Hospitals’ average carbon footprint has remained steady at about 60 pounds of CO2 equivalent per ft2 per year since G/BA began calculating carbon data in 1999.

“If we are going to address the very daunting issue of climate change, the healthcare industry must make greater strides in reducing its carbon footprint,” says Dan Doyle, G/BA Chairman. “As the trend data shows, not enough progress is being made so far.”

Participating facilities displayed a range of usage patterns. For instance, some participants are using more than 200,000 BTU/ft2 in fossil fuel annually, compared with a general mid-range of facilities (about 130,000 BTU/ft2/year) and those that used least (75,000 BTU/ft2/year or less). A few hospitals consume more than 40 kWh/ft2/year in electricity, compared with a mid-range of about 25 kWh/ft2/year; A few squeaked by with less than 18 kWh/ft2.

“Facilities that have high unit costs for energy should view this as an opportunity,” says Doyle. “For example, an energy conservation project that would have a five-year payback at an ‘average’ facility may have a payback of just 2.5 or 3 years at a facility with higher unit costs for energy.”

Hospital water/sewer use is also declining, currently averaging about 45 gallons per square foot per year (compared with nearly 70 gallons/ ft2/year a decade ago). Costs for water/sewer are rising, however, now averaging $0.39/ft2. As recently as 2007, hospitals were paying about $0.27/ft2. “G/BA expects the trend of rising water and sewer costs to continue,” says Doyle. “Price hikes not only reflect increasing costs to extract and treat the water, but also the fact that cash-strapped governmental entities may view water as a revenue source.”

Information for this edition was provided by 137 hospitals located in Illinois (56), Wisconsin (31), Michigan (29), Indiana (10), and six other states.

Full results and analysis, as well as information about participating in the 2017 survey (2016 data), are available on the firm’s website.

Alternative Energy Best Practices Business Commercial Contractors & Installers Engineers & Specifiers Engineering Green Building Health Care Hydronics/Radiant Industry Community News Plumbing Residential Safety Trends Water Conservation Water Quality
  • Related Articles

    Johnson Controls Survey: Energy-Efficiency Investment Flourishes Worldwide

    U.S. Loses Ground in International Energy Efficiency Rankings

    NYC Premiere Energy Efficiency Organizations Collaborate to Launch New York Energy and Environmental

You must login or register in order to post a comment.

Report Abusive Comment

Most Popular

  • SLB Announces Newmans Valve as NEWCO Valve Supplier for Western Hemisphere

  • Duravit Announces New Hires and Promotions

  • PVF Roundtable Annual Golf Tournament Registration Now Open

  • Chicago Plumber’s Union Dyes Chicago River Green for St. Patrick’s Day 2023

Featured Video

Caleffi video thumb

The Gold Standard: Separation with NO Compromise

Industry Events

  • 11Apr

    ASA ELEVATE2023

    Charleston, SC
  • 18Apr

    2023 WQA Convention & Exposition

    Las Vegas, NV
  • 18Apr

    2023 AD Decorative Brands Annual Meeting

    Boston, MA
More Events

Subscribe to our newsletters & stay updated

Subscribe & Learn More

  • Tw03 2023 cover
    Learn More
  • Pe03 2023 cover
    Learn More
  • Phc03 2023 cover
    Learn More
  • Es 2022
    Learn More
Subscribe

More from PHCP Pros

  • Editorial Team
  • Home
  • Contact Us
  • About
  • Advertise

Follow Us

© 2023 All Rights Reserved

Design, CMS, Hosting & Web Development | ePublishing