In today’s data-driven economy, marketers and businesses of every shape, size and structure do their best to capture and decipher data to understand their target audience’s behavior. This data allows them to determine buying patterns, maximize marketing return on investment, and use the 20 percent of the data sets they’re accumulating to operate 80 percent more efficiently and effectively in the core functions of their business.
Many experts claim marketers and entrepreneurs should track many metrics and key performance indicators, resulting in an overwhelming list. However, we are willing to bet that most metrics being tracked on your list are vanity metrics and won’t provide your business much insight or value.
If gaining market share and propelling profit in the most measurable and streamlined ways is a goal for your business, then this article is for you. We will review the top metrics that matter most for your business in 2023 and beyond.
1
How Do Web Searchers Behave on Your Website?
Let’s say Google Analytics reports that your website gets around 3,100 visitors per month. That’s great, but do you know which pages they visit? Where are they spending most of their time on your website? Which words do they read on each page? This is where a heat map comes in handy.
A heat map records (via a video) cursor clicks and all mouse movements. It also shows you the “scroll depth” of all visitors, which tells you the overall effectiveness of your website design. The screenshot, which looks like a weather map, uses the yellow and red spots to show where your visitors are scrolling and clicking the most (see Figure 1). The darker the spot, the better!
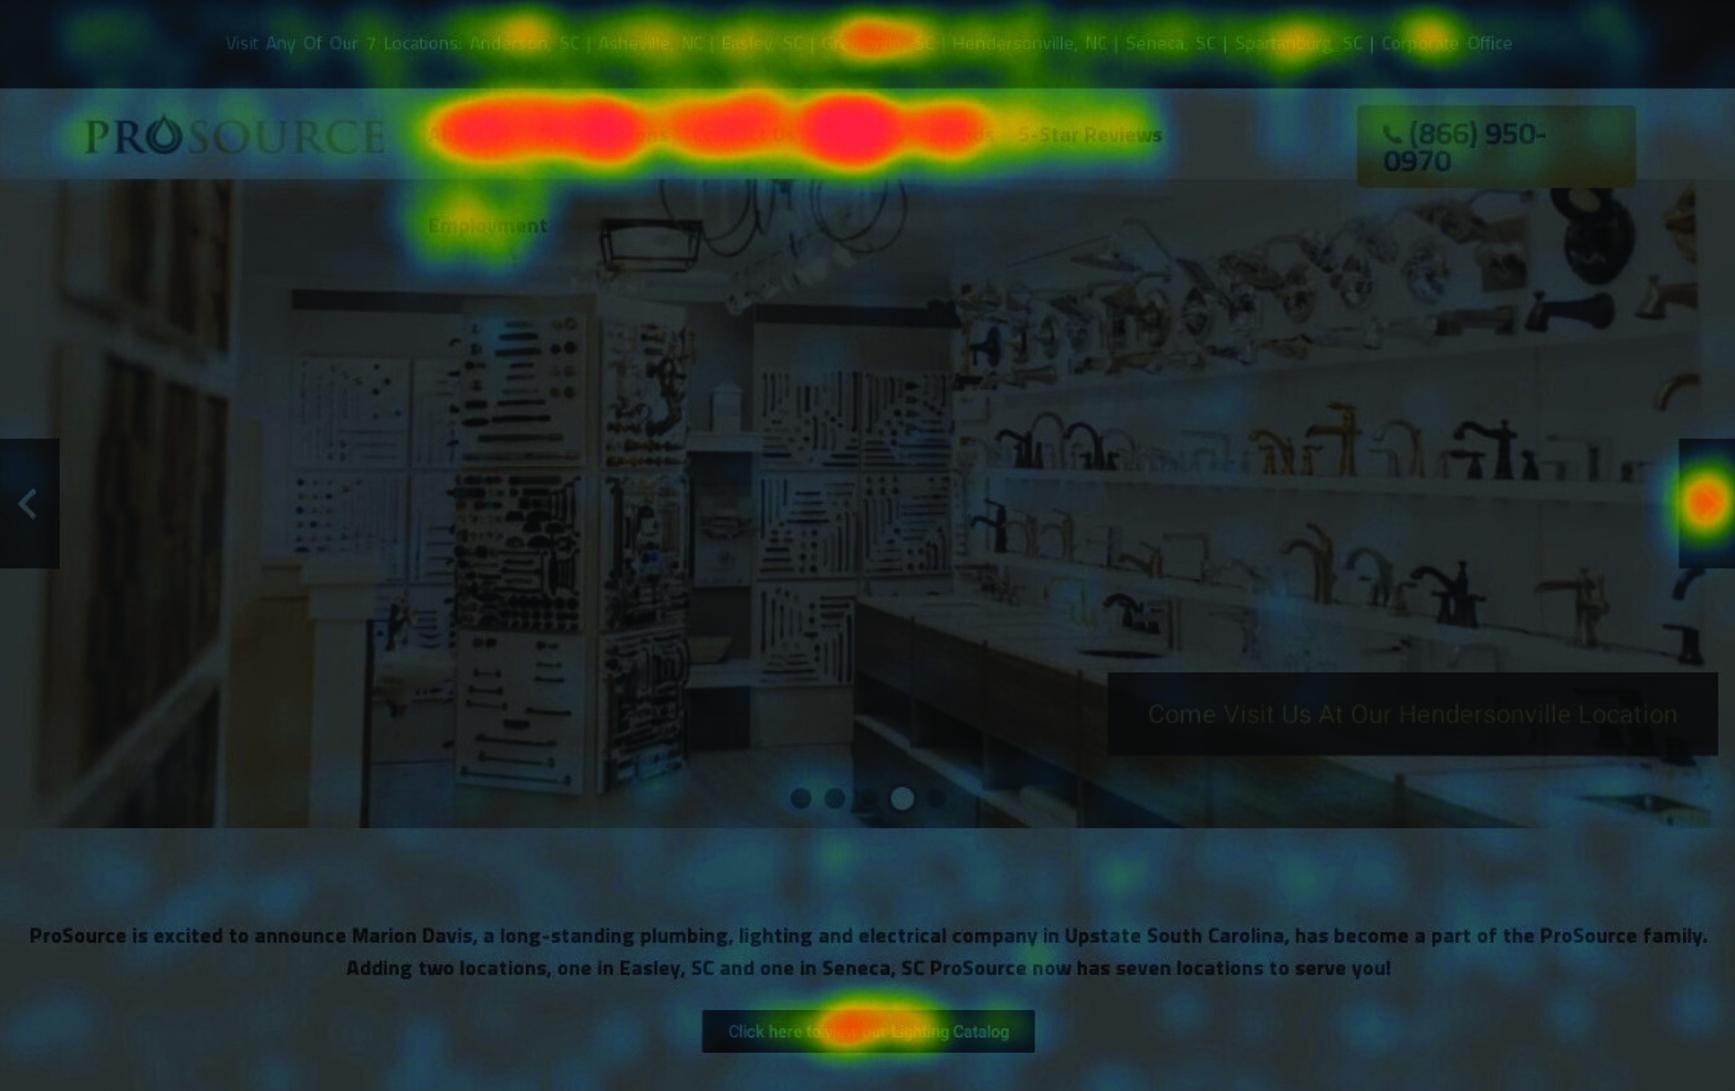
A website heat map gives you an idea of what draws people’s attention when they visit your site so you can understand their thought processes. Figure 1 is a 30-day sample for the homepage of a wholesale distributor.
Rather than studying your whole website or specific pages, you can run heat-map reports for individual pages or study one visitor at a time. For example, you may want to know how a landing page performs for a particular advertising campaign, how web visitors from specific keywords or zip codes are doing, and so on.
Heat mapping records every visitor and can radically improve the value of your website’s visibility.
2
What Are the 20 Percent of Metrics Reporting 80 Percent of Results and Revenue?
Figure 2 shows a Business Intelligence Dashboard with key metrics, which include the following:
- Average time spent on site: All employees should be excluded when looking at this stat;
- Bounce rate: How many visitors do not visit a second page on your website;
- Percentage of mobile users: Knowing this is critical for businesses with an unfriendly mobile site;
- Top pages viewed on your website: Studying if conversions are happening here is key;
- Total number of inquiries/orders: phone calls, form fill-outs, live chats, quote carts and orders.
- The issue with 80 percent of these metrics is that they are “vanity” metrics. In other words, they don’t provide enough capability to reveal significant profit multipliers or grease up any hinges that will swing open giant operational efficiency doors to increase sales and improve your business’s operations.
- On the other hand, the Pareto Principle, aka the 80/20 Rule, states that 20 percent of Internet-measured metrics are responsible for generating 80 percent of results and revenue.
- The dashboard showcases a few of the top metrics that matter that your company must also be measuring:
- In-state vs. out-of-state website visitors: Many bots are skewing these numbers;
- Total time a visitor spent on your website: Heat mapping will allow you to watch them;
- Top devices your website visitors use: You’ll know the screen size and browser type, too;
- Contact page visits vs. the number of actions: Divide the actions taken by contact page visitors;
- Total number of marketing qualified leads (MQL): How many phone calls, forms, walk-ins, etc.;
- Total number of sales qualified leads (SQL): In-store sales plus sales from a webstore;
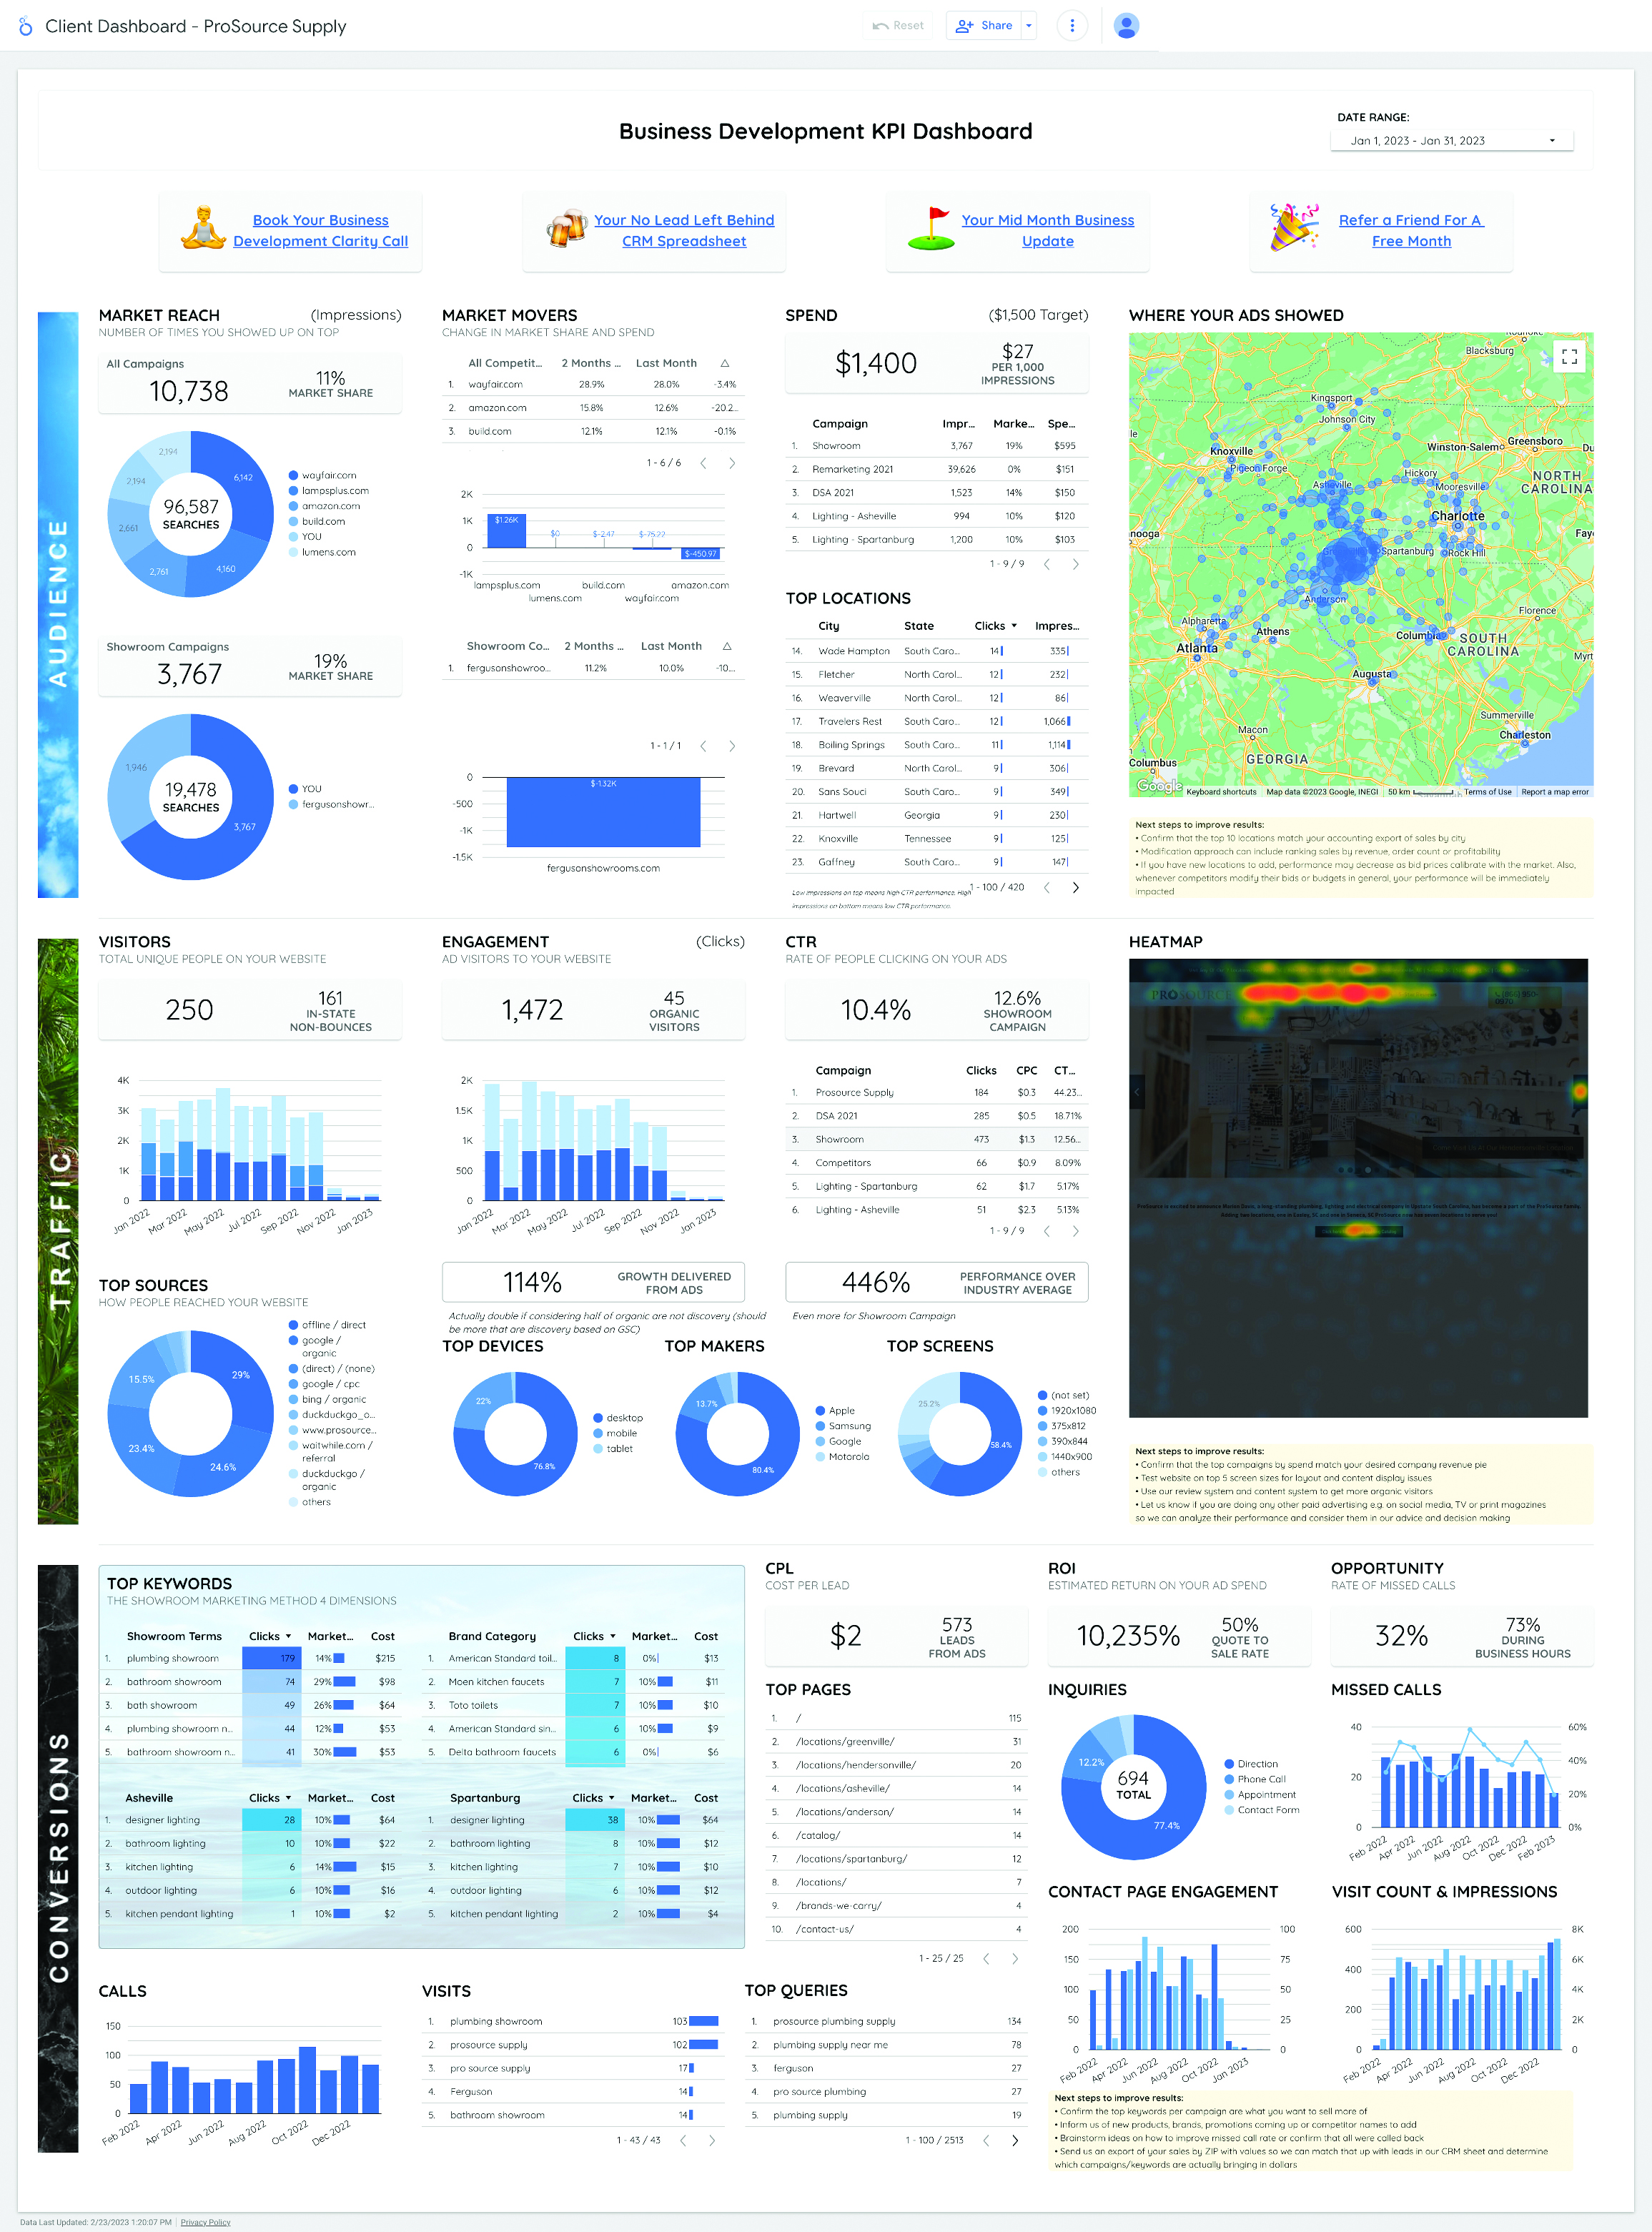
Click-through rate from your Google Ad campaign: Of every 100 people who see your ad, how many click it?
Market reach/impression share from your Google Ad campaign: This is the exact number of eyeballs seeing your ads, plus how to scale;
Revenue generated on the site vs. through the site: Yes, there is a difference — e-commerce vs. inquiries;
Total number of abandoned quote carts or orders: These people need to be reached out to and retargeted online.
A fully developed Business Intelligence Dashboard can tie all your technologies together. It lets you understand the important metrics about how your marketing information leads to sales opportunities. Focus on what matters most: attributing sales opportunities and revenue from all the activity you get on your site.
3
What is the Source For Each Website Inquiry and Dollar Collected?
“Source” indicates how a visitor found and arrived on your website. In most cases, a visitor reaches your website via an organic search engine search, social media, a referral site or business directly (such as Yelp or Google My Business), somebody who had your site bookmarked or typed in your site URL directly, or a paid ad source such as Google Ads.
At this point, just knowing every visitor on your website can and should be put into a pile is enough to be dangerous. However, after you put every visitor into their appropriate pile, you can see which source brings you the most inquiries. You’ll be tracking phone calls, contact form fill-outs, live chat and wishlist submissions, B2B e-commerce orders from a new company or an existing account, and so on.
Tracking phone calls from all sources and inquiry tracking at large is probably the most important one on this list. The number of inquiries — phone calls, form fill-outs, wishlist/quote carts created, walk-in visitors to a physical location, and orders purchased through a webstore initiated from your website — allows your business development initiatives to get measurable, predictable and scalable results.
Are you currently tracking these from your website?!
4
What is the Average Turnaround Time for Replying To an Inquiry or Sale?
After reviewing the number of inquiries and sales you receive on a daily, weekly and monthly basis, your team should export this list into a spreadsheet. This way, every inquiry acts as a “line item” that you can move manually. You also can develop a custom integration for your business that automatically uploads each inquiry directly into your CRM, ERP and project management software. This allows for a much shorter response time from when an inquiry comes in to when a sales associate reaches out.
When you can look at the total number of inquiries and sales that come to your business in an “inquiry pie” format, you can calculate cost-per-lead per channel via the web and your customer acquisition cost per channel (see Figure 3). This can only happen when you have the data in your business development initiatives segmented and optimized properly.
![]()
If your company isn’t running more efficiently and transparently with this granular-level reporting each month, then something is likely happening on a much larger scale.
Finally, if you’re looking to yield a 3:1, 5:1 or more than a 10:1 ROI from the online channel, the number of inquiries you’ve received from the 3,100 web visitors who reached your site is much more impactful than knowing how much time they spent or how many pages they viewed while on your site.
5
In Your Most Profitable Locations, What Percent is Your Website Being Seen Organically and With Paid Ads?
Out of all the visitors who land on your site, it is vitally important to know what percentage of those visitors came from your top towns and zip codes (if you service a more local clientele), what percentage are searching from your top states, and the page(s) they are viewing.
These numbers are important because they tell you exactly where to target your search engine optimization efforts, as well as where to put more pay-per-click spending if you’re running Google ads.
One of the greatest benefits of having a live Google Ad campaign is that you get to see exactly how many searchers there are online for the items you want to sell most in the areas where you want to transact more business (see Figure 4). Even if you’re just using Google Ads to get market trends, etc., it’s still a savvy investment.
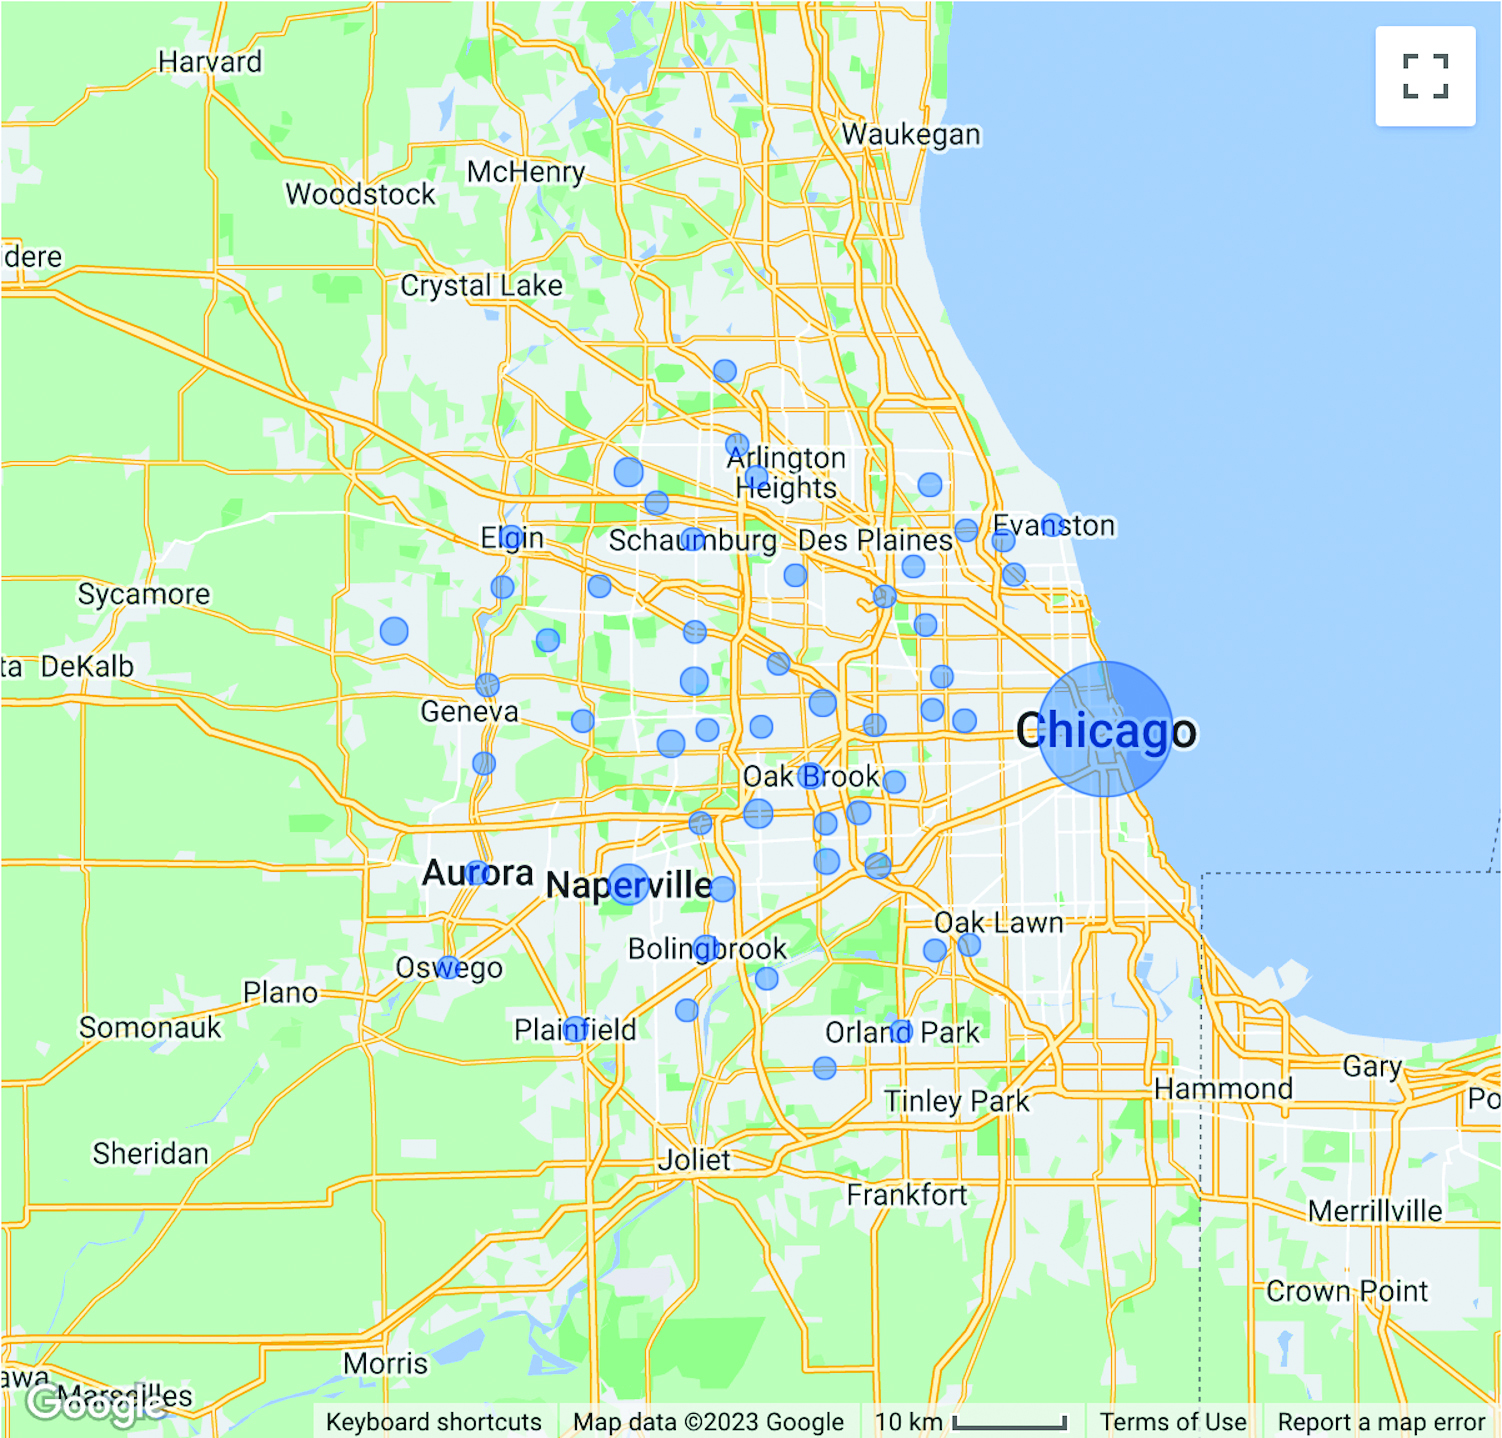
Finally, knowing your numbers is the beginning of “steering your ship” while navigating the online ocean. Still, things will hit a whole new level when you know how your competitors invest their advertising dollars — which can also be done from your Google Ad account.
6
What Are the Top Keywords Searched in Your Service Area(s) Bringing People With The Highest Buying Intent to Your Website?
Keywords are the most powerful thing to reference when creating content such as blogs, videos, enewsletter copy, press releases or Google Ad campaigns.
By understanding your high-performing keywords, you can further optimize your advertising copy, website content and messaging during your follow-up efforts, as well as what to do during the sales process that will generate revenue faster and in a more systematic fashion.
Figure 5 shows the four dimensions for dominating the first page of Google for a wholesale or retail distributor of any entity size, shape or structure in the decorative plumbing and hardware (DPH) or pipe-valve-fittings (PVF) industry.
![]()
Dimension No. 1. Get all the top keywords and search terms figured out to attract B2B and B2C searchers who would type into Google to find a brick-and-mortar business that sells what you do.
You can see in Figure 5 that 71 searchers clicked on an ad that was targeting “plumbing showroom” in this geographic area. There were 52 searchers who clicked on an ad for “plumbing store” and 22 searchers who clicked on an ad for “plumbing store near me,” an entirely different universe than “plumbing store” in Google’s eyes.
These searchers typically want a brick-and-mortar experience, and no online superstore can offer a brick-and-mortar experience, so take full advantage of this.
Dimension No. 2. There are dozens of product categories that DPH and PVF businesses have on inventory or have access to if they don’t stock a product in their physical place of business. You can see toilets, shower kits and kitchen cabinets are the top five categories searched for this business.
Dimension No. 3. DPH and PVF businesses have access to hundreds of brands. Some of the product is available in-store, some can be ordered on a website with e-commerce (a webstore), and some products can be ordered directly with the brand as well as drop-shipped by a manufacturer.
Drop-shipping (done on behalf of a dealer) and using co-op cash on various Internet channels are emerging trends that will only rise in popularity over the next few years. #TakeActionASAPOnThis
Dimension No. 4. How great would it be if your business appeared at the top of the first Google search page when consumers searched one of your local or national competitors? Well, this is exactly what happens with this fourth dimension. When a search is submitted for one of your competitors, your ad and business will display for that searcher, who hopefully will reach out to you while surveying the options.
If the searcher accepts your offer to quote differently or better on his project, you have created a nice upper hand for you to win new business.
Now, this is the fourth dimension because it’s not a strategy to be used in large dosages.
You know who your top three to five competitors are because many times they have a Google Ad account themselves, which allows you to tap into some of their advertising’s secret sauce. Use what you find useful to get more of the people you’re looking to attract in that area to look your way instead!
John Gosselin is CEO of ShowroomMarketing.com. If you would like a complimentary Business Intelligence Dashboard created for your company, please contact him at [email protected]. John will work with his team to get your company the best game plan needed for winning more business, controlling more market share, and being more high-tech and high-touch on the Internet. #TurningOnlineInsightsIntoIncomeIsFun