
If you read my May article, you know that I recently bore witness to a large discrepancy between calculated and measured flow rates in an existing hospital. This particular project had a total of 3,685 WSFUs, which equates to a flow rate of about 500 gpm using Hunter’s Curve. When we put an ultrasonic flow meter on the water supply, the measured peak flow rate was consistently 140 gpm, mid-day weekdays. This is predominantly an outpatient facility. Weekend peak flows were consistently about 70 gpm; these flows do not include the cooling tower or irrigation.
Interestingly, I recently learned that IAPMO has been working in concert with ASPE, WQA, Aquacraft and an assortment of industry professionals on the development of a Peak Water Demand Study and associated Water Demand Calculator (WDC). You can read a great deal of detail about this on IAPMO’s website (search IAPMO WEStand, which is the American National Standard for water efficiency and sanitation, and go to Document Information).
The Peak Water Demand Study explains how the WDC was developed. It is an excel calculator that determines flow for residential buildings based on fixture quantities. It does not use Hunter’s Curve, but rather a modified Wistort method. It calls upon empirical data provided by Aquacraft, the largest available U.S. residential water use survey. The data was used to generate p-values and q-values. Not to be confused with pints and quarts, p-values are a measure of fixture frequency of use, while q-values are the fixture flow rates in gpm.
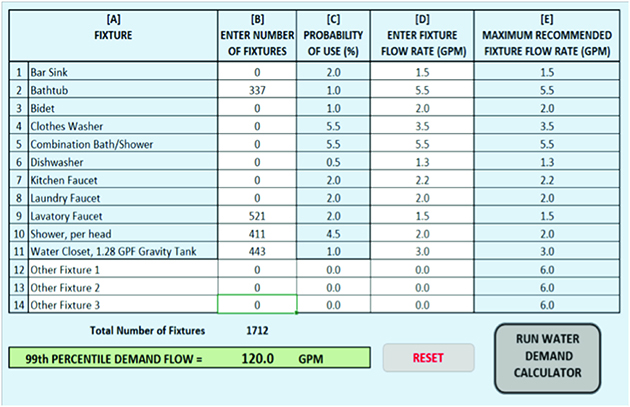
To test the calculator, I plugged in values from one of my projects, a hotel with 394 guest rooms. Fixture quantities can be seen in the calculation table, and the output generated was 120 gpm. Using fixture units and Hunter’s Curve, the fixture units total up just shy of 3,800 WSFUs, which equates to 520 gpm. That is quite a difference. This example is not unlike the hospital example in the opening paragraph of this article. The results from the WDC are very close to the measured real flow rate that we found at the hospital, a facility with a comparable number of fixture units. While you can’t really compare a hospital with a hotel, I believe the WDC produced a realistic flow rate that is less than 1/4 that produced by Hunter.
 Note that it is not my intent to slam Hunter in this article. The work he did was cutting-edge and invaluable to the industry. But the advent of low flow fixtures and water conservation in general has necessitated that it be updated to prevent over design of systems and equipment. The WDC can also be used to determine hot water flows simply by deleting the cold water only fixtures. If your system has instantaneous hot water heaters, the flow rates can be used for selecting the water heaters. I did this and found that the hot water results were similar to those produced using the modified Hunter’s Curve produced by ASHRAE many years ago.
Care should be taken in using this calculator since it has not yet been adopted by the UPC (nor the IPC), but I understand it may become part of the 2018 edition. This flow data could be used in sizing domestic pumps, instantaneous water heaters and piping as well, but it might be quite difficult to get your local AHJ to accept it, especially since it deviates so dramatically from the code. I applaud IAPMO and the entire team for producing this gem. I have long known that most plumbing systems are dramatically oversized, but I have never had anything but my own observations to back that up.
Their work started six years ago in July 2011. The data they sourced from Aquacraft included 1,058 single-family homes scattered nationwide. Every home had water-conserving fixtures. Twenty of the homes had to be dropped due to periods of inactivity (vacations). The homes were monitored for 14 days.
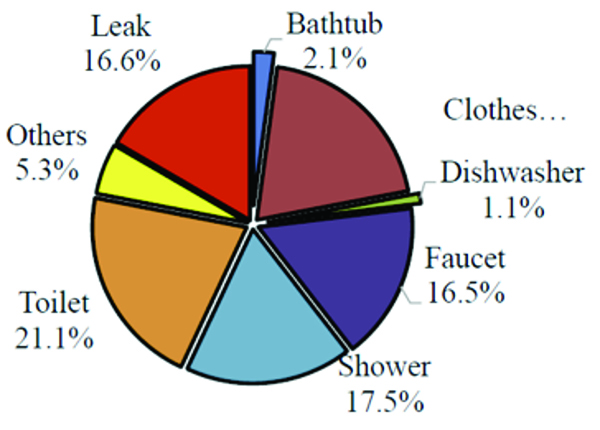
Looking at the calculation spreadsheet, I was reminded of a quote from my former boss Richard Reilly, “Fixtures don’t use water, people do.” The water demand study team did its calculations, factoring in the population as well as their ages. There were 2,821 occupants who produced 863,000 water use events over the course of 11,385 home-days monitored between 1996 and 2011. They used a process of “exhaustive enumeration” to compile the data. Average gallons per person consumption was 60 gallons per day. Ninety-eight percent of the homes had leaks that accounted for nearly 17 percent of the water consumption, and these were factored out for the calculator.
 For single-family residences (SFRs) the period of greatest water use was the weekends, so this is the data that was used in determining the peak demand.
One might argue that a single-family home isn’t reflective of a large multi-family residence like an apartment building or high-rise condominium, but when you look at the aggregate of over 1,000 SFRs, it is like looking at a building with 1,000 condos.
As a point of interest, refer to the pie chart that shows the breakdown of fixture use. It is truly fascinating to have this real data to examine. Many thanks to the research team for their efforts.